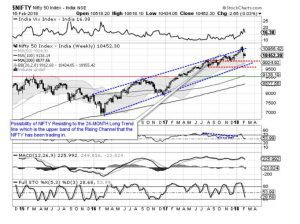
The last trading day of the week saw the Nifty taking a cut, ending the day with net loss of 93.20 points, or 0.88 per cent on Friday. This has seen the benchmark index ending the week on a flat note, losing just 2.65 points, or 0.03 per cent on a weekly basis.
Markets have decoupled themselves from the global markets, but for the wrong reasons, only when we saw stability returning in the global markets. Though we can take solace that fall in our markets is arrested as we ended flat after losing 3 per cent in each of the two previous weeks. But at the same time, we have grossly underperformed the global peers.
The most correlated market – Hang Seng – ended the week gaining 5.45 per cent. Dow closed the week gaining 4.25 per cent. Nasdaq and S&P500 added 5.31 per cent and 4.30 per cent, respectively, on a weekly note. The hit that the domestic index took was much of sentimental nature. We have a lot of catching up to do this coming week.
Subject to global markets remaining stable, we see Indian markets approaching the week on a positive note and we may see stability returning to our markets. The levels of 10,750 will act as immediate resistance while supports will come in at 10,250-10,300 zones.

The Relative Strength Index – RSI – on the weekly chart is 53.9947 and it has marked a fresh 14-period low, which is bearish. It also shows bearish divergence as RSI has marked a fresh 14-period low while the Nifty has not done so. Weekly MACD is bearish as it trades below its signal line. No significant formations were seen on Candles.
While having a look at pattern analysis, the Nifty is seen resting at the 20-period Moving Average on the weekly charts. Volumes are seen reducing each following week and this shows that selling is now trying to slow down and the Nifty still is in the process of finding a bottom for itself.
We also approach the expiry of the current derivative series in the coming week. This will also see volatility in the markets, but unless a fresh skeleton drops out of a cupboard, there are high chances of the markets attempting to find bottom at current levels. However, until a confirmation is achieved, we will still recommend staying put with strategy of maintaining modest exposure while avoiding shorts and protecting profits at higher levels.

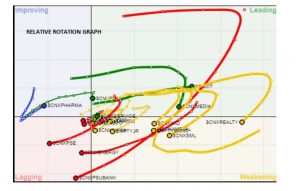
A study of Relative Rotation Graphs – RRG – shows that pharma stocks are steadily improving the relative performance and along with that, the IT pack is likely to distinctly outperform the general markets. Apart from this, metal stocks are showing stark improvement on both ratio and momentum and are likely to continue to strengthen its position and attempt to relatively outperform. FMCG has seen some drop in momentum. Apart from this, reality, Nifty Next 50, and other broader Indices are seen losing momentum. No major show is expected from PSU banks, Bank Nifty, public sector enterprises, energy and infra pack. Some minor stock specific outperformance may be seen in media stocks.
Important Note: RRG™ charts show you the relative strength and momentum for a group of stocks. In the above Chart, they show relative performance as against the Nifty index and should not be used directly as buy or sell signals.


